XIX. Customize screens and the vario
With the Evolution, you can customize the vario sound and screen display endlessly.
To configure your screens (available on video https://www.youtube.com/watch?v=D3lfZWiS13M) :
1) Go to this page: https://www.syride.com/en/ssctool/Evo_v2
2) Configure your screens by choosing: font, size, position and desired unit. To do this, simply drag the information you want to view onto the flight screens (see list of items at the end of the section).
3) Download the configuration file to your computer.
4) Turn on and connect your Evo to your computer's USB port (or via Bluetooth to your phone).
5) In the Syride Link software click on the icon “ Send a file”.

6) Select the configuration file you previously downloaded.
Feel free to share or create a library of configurations according to your needs.
The vario configuration follows the same principle. An explanatory video can be seen here: https://www.youtube.com/watch?v=3w4dxw3T_Vk
More information on the screen configurator items: ⚠️ Important note: a “NO GPS” on an item means it is waiting to receive the GPS signal to display the information):
GPS altitude : it is obtained thanks to the GPS signal. It is the distance separating you from mean sea level. It is a relatively reliable altitude but can be very inaccurate in case of poor GPS signal reception (interference related to radio, relay antennas or other instruments…). It is increasingly less used as a reference value for paragliding, the Fédération Aéronautique Internationale recommending the use of pressure altitude (QNH, see below).
QNE altitude : this is an altitude referenced to a standard pressure (1013.25 hPa). This is referred to as flight level. In France, this altimetric setting is applied as soon as you exceed 3000 ft sea or ground, as soon as you exceed a transition altitude (called TA) or if you are in airspace quoted in Flight Level (FL). This information is rarely used in classic paragliding flight except to avoid entering FL-classed airspace.
QNH altitude (recommended): this altitude initially uses the GPS signal until vertical accuracy is within plus or minus 5m. Then it uses ambient pressure to calculate your altitude. If you raise your instrument by one metre with your hand, the altitude will rise by one metre (which will not necessarily be the case with GPS altitude). This altitude is very accurate but can become less reliable if you fly for a long time or travel a long distance.
Vario : this is your vertical speed (climb or descent). Vario smoothing is possible by changing the filtering parameter when configuring your screens. 5 seconds of filtering means the displayed vario will be an average of the varios from the last 5 seconds. Each vario can have a different filtering.

Altitude history : this is a graph representing your QNH altitude over the last 2 minutes. Displayed are: max altitude / min altitude / altitude curve and terrain (in light gray).

Vario history : this is a graph representing your vario over the last 2 minutes. Displayed are: max vario / min vario / vario curve.

Dynamic vario graph : this is a bar graph representing your instantaneous vario. It adapts to the day's conditions. The graph's max starts at +1 m/s and when you obtain a larger climb or descent rate it adjusts its scale.
G-meter : g is the initial of “gravity”. It is a unit of acceleration that corresponds approximately to Earth's gravitational acceleration. If your Syride indicates 2 g, you will feel like you weigh twice your weight.
Gain since takeoff : this is the vertical distance separating you from your takeoff point. A positive gain means you are above the takeoff and vice versa.
Straight-line distance from takeoff : this is the horizontal straight-line distance separating you from the takeoff point.
Cumulative distance since takeoff : this is the distance you have accumulated since your takeoff. It corresponds to the length of your GPS track if you unfolded it and measured it.
Heading to takeoff : this is the heading to take to return as quickly as possible to your takeoff point. It can be useful in paramotor to find your departure as quickly as possible.
Atmospheric pressure : this is the atmospheric pressure in hectopascals (or millibars) measured by the pressure sensor.
Instantaneous glide ratio : noted “GRI” for “Glide Ratio Instant”, it gives you your wing's glide relative to the ground: GRI = Ground speed / Vario. A tailwind will increase your glide and vice versa.
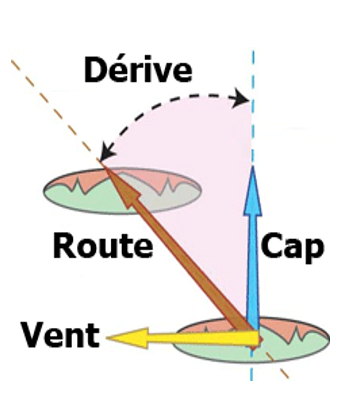
Heading indicator : this is the direction your instrument (and therefore your wing) is pointing. It is an angle in degrees from 0 to 360° provided by the instrument's magnetic compass.
Track : this is the direction followed over the ground. It is an angle in degrees from 0 to 360° provided by the instrument's GPS. Without wind, heading and track are identical.
Drift angle : this is the angle between the track direction and the heading. A zero drift angle means there is no wind. The larger your drift angle, the stronger the crosswind.

Temperature : this is the temperature measured by the instrument. Without relative wind, this temperature may be higher than the outside temperature due to heating of electronic components.
Wind info graphic : to obtain wind speed and direction, you must complete a full turn with a constant turn of at least 8 seconds in calm air. The instrument will calculate your drift and estimate wind speed and direction.
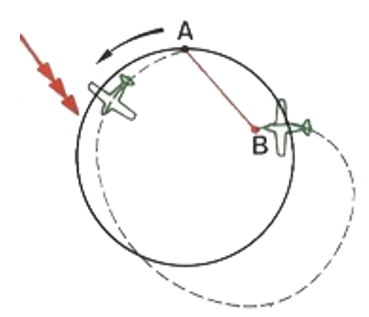
When the indicator arrow points up with “10” written inside, it means you have a 10 km/h tailwind. Conversely, if the arrow points down, the wind is coming from the front.

Wind direction : this is where the wind is coming from using the cardinal points: N (North), NW, W (West), SW, S (South), SE, E (East) and NE.
Height above ground : this is the distance separating you from the ground. This information subtracts in real time the ground altitude (recorded in the instrument's memory) from your current pressure altitude (QNH).
Resettable cumulative distance : this item displays the cumulative distance flown with your instrument. It can be reset by clicking on the item (a confirmation message will appear). It is saved even after the instrument is turned off.
GPS coordinates : this is your current position. By clicking on the item, it is possible to display the 3 most used coordinate formats.
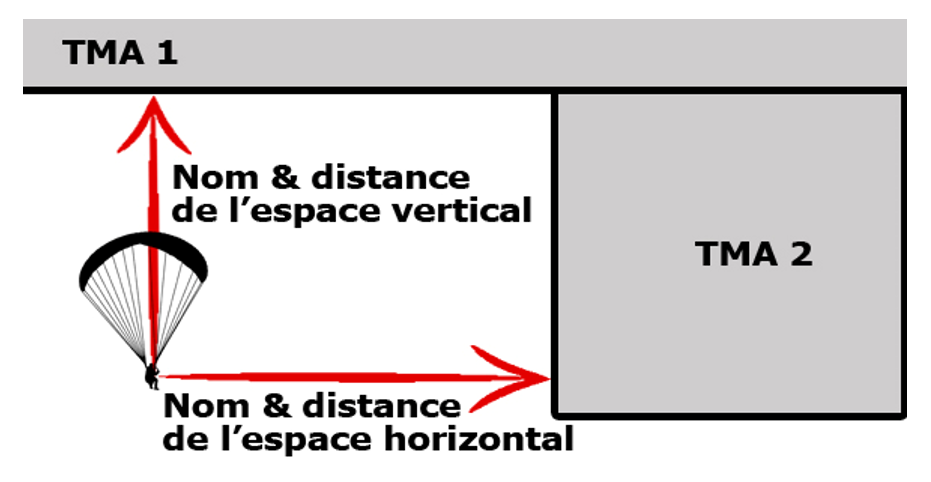
Airspaces : the image below indicates the different items locating you with respect to airspaces. The reference altitude for distance calculations is based on your pressure altitude (QNH).
Augmented reality : augmented reality represents in 3D the terrain, turn points and airspaces in front of you.

Transition assistant : this is a cross-sectional view of the track followed over the ground (which can differ from your heading depending on the wind). You will find terrain, turn points and airspaces. The horizontal scale is adjustable in flight.

Route summary : this is a synthesis of your navigation route. You can quickly know where you are in your navigation or in your competition task.
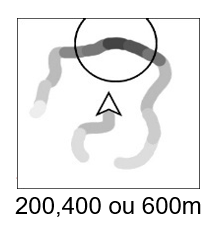
Thermal core : the goal is to quickly identify the most rising area around your position. As soon as you record a positive vario, a trace will appear around your central position. The darker it is, the stronger the vario. A circle automatically indicates the center of the strongest recorded vario. A click on the item changes the zoom level.
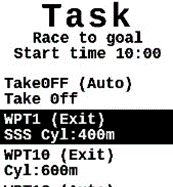
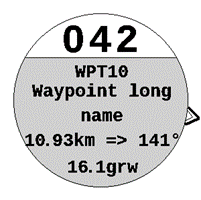
Waypoint information : ultimate tool to follow a navigation route and reach the next turn point in optimal time. Once a route is loaded, you will get on this item: the name of the next turn point, the distance to it, the track to take to tangent the turn point radius and your current track. In the example on the right, the next turn point is called “WPT10”, it is 3021 m from your position, you must take a track of 003° to the left because you are currently flying at 042°. The graphic helps you obtain the correct direction. The black arrow indicates the route to tangent the turn point (optimized route) and the white arrow to go to the center of the turn point.

The full Waypoint information does a 360° and also indicates: the long name of the turn point as well as the glide ratio required to reach the optimized point.
Height above ground at next turn point : this is the height you will have under your feet when arriving at the optimized point of the next turn point. It is based on the actual ground height of the optimized point and not that of the turn point center. This item is useful for example in competition to evaluate the margin you will have when arriving at a turn point or the goal.
Time and arrival time at next turn point / goal : this is the time it will take you to reach the turn point at the optimized point. This time is obtained according to your ground speed and the distance separating you from that point. Likewise, it is possible to know the time at which you are expected to reach the turn point.
Competition time : this is the time elapsed since the start of the competition task. If it is a race to the goal, the time starts at the start time. If it is a minimum time, the time will start when crossing the SSS. If you recross the SSS (before crossing the next turn point), the time will restart at 0. Moreover, in this case, the SSS cylinder remains visible and flashes on the map to symbolize that it can be recrossed.
Remaining competition time : this is the time left before the end of the task. It is based on the time you entered in the ESS when entering your task. This time decreases.
Glide to waypoint : noted “GRW” for “Glide Ratio Waypoint” it gives you the glide required to reach the optimized point (see below) of the next turn point. The altitude used to calculate the glide is that of the topography at that point and not that of the turn point center.

Glide to goal : noted “GRG” for “Glide Ratio Goal”, it gives you the glide required to reach the goal (passing the optimized points of previous turn points if necessary). Be careful, wind can degrade your ground glide and prevent you from reaching the goal at the desired altitude.
Drawing options : these items allow you to add free text as well as geometric shapes to your screens.
Weather station : use this item to view real-time weather readings. To obtain this information, you must either be on a WIFI network with internet access or connected via Bluetooth to your phone. Your phone must also have network coverage to download the data.

Once the data is accessible, you will obtain depending on data availability: the station name, the update date, wind direction, minimum, average and maximum wind speed. When configuring your screen, you can choose to have the Evolution display the station closest to your position or select it from a list.

Map : on the map the following are displayed depending on the zoom level and selected parameters: terrain, roads, names of major cities (more than one million cities in memory), airspace boundaries, your position, the history of your GPS track, the position of Syride base takeoff sites, the loaded navigation route (including turn points, their radii and the optimized route)… It is possible to have several maps with different parameters in the instrument!
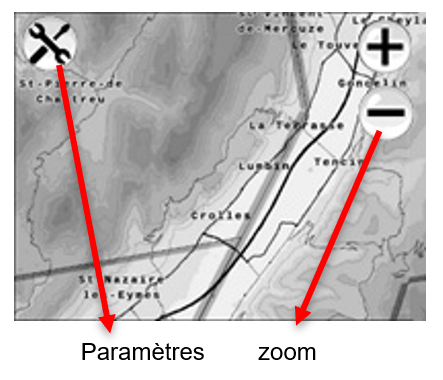
By clicking on the map's “Settings” icon, a menu appears:

 Here are the available layers:
Choice of map orientation with either heading up or north up
Display of topography
Display of road map
Display of city names
Display of airspace boundaries
Display of contour lines (only at high zoom levels)
Display of the thermal map (white circle). The base comes from the site https://thermal.kk7.ch/ . Your Evo takes into account the date and time to display the most probable thermals.
Display of the names of peaks around your position
Display of the assistant to perform FAI triangles
Display of your track history
Display of the current navigation route
Page 2:
Display of the turn points present in your instrument's memory.
Display of your arrival point with your current glide ratio.
Activation of auto-zoom (occurs when you approach a turn point or an airspace).
Display of pilots (or selection of pilots) live on the map (more details here)
Display of high voltage power lines
Display of aerial cables
Display of aerodromes (with runways and taxiways)
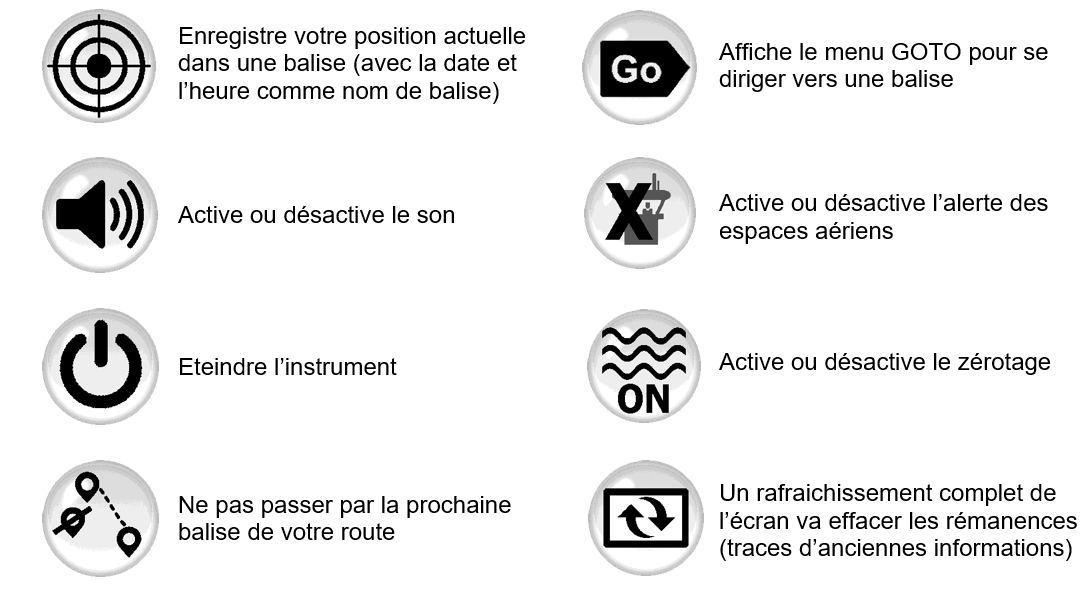
Buttons : take shortcuts by adding direct action buttons to your flight screens! Here are some examples:
Use automatic screen switching : to avoid manipulating the instrument in flight, it is possible to display the screen of your choice according to the situation encountered. This setting is done when you configure your screens online:

Airspace : displays if you are in an airspace or in a pre-violation zone.
Thermal : if the instrument detects that you are circling and that your vario average increases.
Transition : if you do not meet the thermal criteria, this is the default screen that will be displayed.
Turn point approach : when you approach within less than 200 meters of the next turn point.
Note:
to avoid unwanted changes, after a manual page change, automatic change is blocked for 2 minutes.
it is possible to disable automatic screen switching in flight using the corresponding button. If it is a change related to an airspace, it is also possible to disable the current airspace.

Last updated